Google’s new trend change detection is a feature that helps businesses identify significant changes in their data, which can be helpful for spotting potential problems or opportunities, and making informed decisions about how to proceed.
Understanding behaviour can also help businesses to predict future behaviour, allowing them to take advantage of it better.
Similar to anomaly detection
It’s a similar feature to anomaly detection, which can be used to detect sudden changes in your data. Some of it may be predictable, such as a change in web traffic after your massive clearance sale goes live, but others are more unpredictable, as Google explains.
“For example, due to a recent update to your website code, the registration button on your website stops working. You may not notice an immediate drop in active users, but over time, your growth rate stalls as fewer users are able to register. Analytics will detect this change so you can make any necessary adjustments to your site.”
How it works
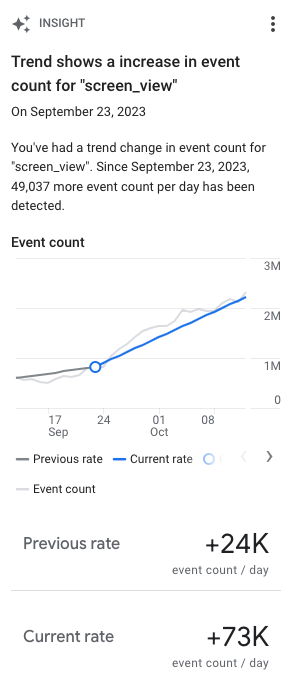
If Google detects a change in a metric, it will overlay a circle on the date when the change happened. To see what change occurred, hover over the circle and you’ll see a few quick bits of information about it, such as the rate of change and when it occurred.
You can also access a more in-depth report from the Insight tab in Google Analytics. The report includes information about the magnitude of the change, the direction of the change, and the time period over which the change occurred.
Four types of trend changes are detected:
- An increase to a decrease.
- A decrease to an increase.
- A greater increase or decrease.
- A lesser increase or decrease.
Trend change detection can be used for a variety of purposes, including:
- Identifying potential problems: If you see a significant change in your data, it could be a sign of a problem. For example, if you see a decrease in sales, you may want to investigate to find out why.
- Identifying opportunities. For example, if you see an increase in traffic to your website, you may want to consider ways to capitalise on that traffic.
- Making informed decisions. By understanding the trends in your data, you can make better decisions about how to allocate resources, set goals, and measure your progress.
How to understand trend changes
Before making any drastic changes, it’s important to consider if this change was expected and what the cause may be. If it’s a good change, you don’t need to do anything at all – apart from understand why the positive change happened and keep doing that thing!
If you’re stumped as to why a change occurred, it could be one of the following reasons:
- Change to your business cycle, such as the end of a big consumer season (Christmas, Black Friday etc).
- Change to Analytics property. Make sure you check in Admin – Property – Property change history to see if changes occurred before the trend change.
- Changes to your website or app can result in a negative trend. If you haven’t set up your site properly, you can experience latency issues, long loading times, misconfigured meta data (which will impact organic results).
How Analytics detects trend changes
Now, hold on to your hats because this next section is going to get geeky. Google Analytics Intelligence applies a signal segmentation algorithm to a time series to detect changes in your trends. The typical training period for detecting daily change is 90 days and weekly data is 32 weeks.
“The model segments the time series into several parts so that in each part, the data shares similar patterns while different parts have different patterns. The boundary points between two parts become the trend changes that we report.”


RECOMMENDED FOR YOU
The CMO Role Is Being Rewritten
The chief marketing officer title is disappearing from many…
The chief marketing officer title is disappearing from many…
[STUDY] LinkedIn Ads Influence More Than Leads
LinkedIn advertising remains expensive by most conventional performance measures.…
LinkedIn advertising remains expensive by most conventional performance measures.…
ChatGPT Builds Out Its Ad Platform
OpenAI is rapidly adding the campaign controls, audience tools…
OpenAI is rapidly adding the campaign controls, audience tools…