
In a move that many will celebrate, Meta has announced that it has added Stories posting capacity to its Graph API so marketers can finally use third-party platforms to publish Stories on Instagram.
Meta says the feature…
“Adds another media post type to third-party platforms and gives businesses broader access to a highly requested feature that is integral to the Instagram experience for businesses, creators, publishers, and users.”
Stories have become a really important part of marketers’ social media strategies. It’s one of the key engagement formats on Instagram, and it’s no surprise that Meta has finally given people what they’ve been asking for.
Business benefits
The change will make it easier for marketers to manage all their content from a single platform and will let business accounts publish up to 25 single images, videos, Reels or carousel posts containing multiple images and videos per day using third-party developer platforms.
If you’re using a social media management platform, then the changes should be available soon. Meta says that “Stories will become automatically available for developers who already have access to the Content Publishing API.”
Story benchmark study
While a study by RivalIQ showed that Stories reach rate has fallen compared to last year, there’s no reason to panic! Strong competition from the likes of TikTok and YouTube means that people only have so much time in the day for scrolling. As long as you’re keeping up with industry benchmarks, you’ll be sweet. And if not, scroll to the bottom of this article for some advice on how to fix that.
Even though posts typically command a higher reach than Stories, that doesn’t mean Stories should be neglected. Posts can be used to draw a viewer to your profile, and then Stories can deepen a user’s engagement with your brand.
One metric that highlights how important clever, engaging Stories can be is the tap-back rate. The fact that tap-back rates are higher than they were last year is a good sign and a good indicator of how engaged viewers are with your Story (more on that later).
Stick with us for some more insightful data on the subject.
How often to post?
It’s important to post consistently and the average brand does so about 11 times a month, with most brands posting two frames per story. Most brands don’t have huge big frame numbers – but that shouldn’t stop marketers from experimenting with what works for them.
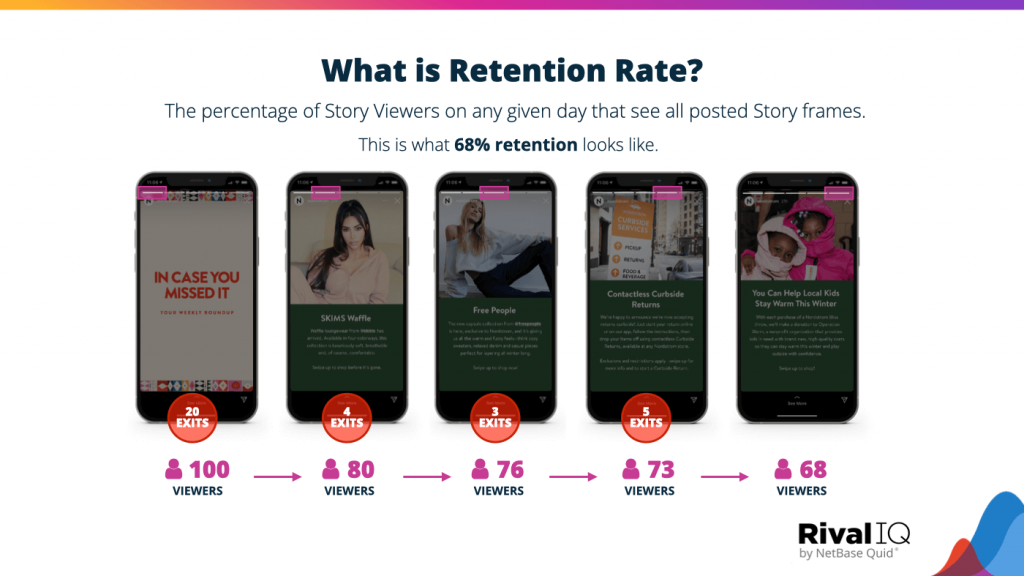
Retention rate shows how many people are sticking around to view multiple story frames. The median retention for the fourth frame is around 81% of viewers. Once you have a viewer on your Story, if you can create interesting stuff that compels them to keep tapping through your frames, you’ll have a high retention rate. If not… time to think again.
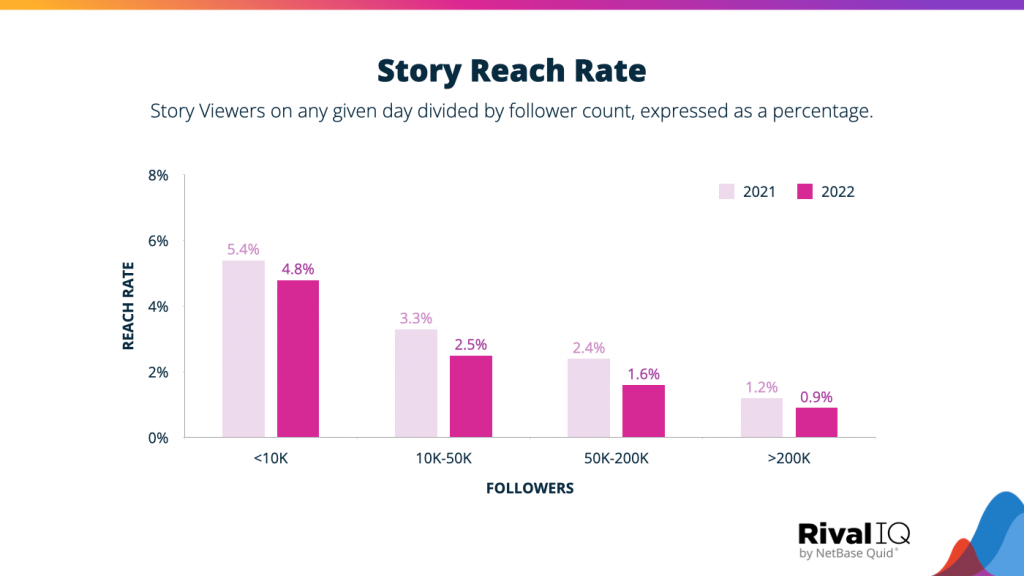
Reach rate is down
Story reach rate declined across the board compared to 2021. For accounts under 10k, it was 4.8%, compared to 5.4% in 2021. For accounts of 10-50k, it was 2.5%, down from 3.3%. For accounts between 50k-200k it was 1.6%, down from 2.4% and for accounts over 200k it was 0.9%, down from 1.2%.
Are your numbers below these industry benchmarks? Try adding interactive elements such as links, questions and quizzes.
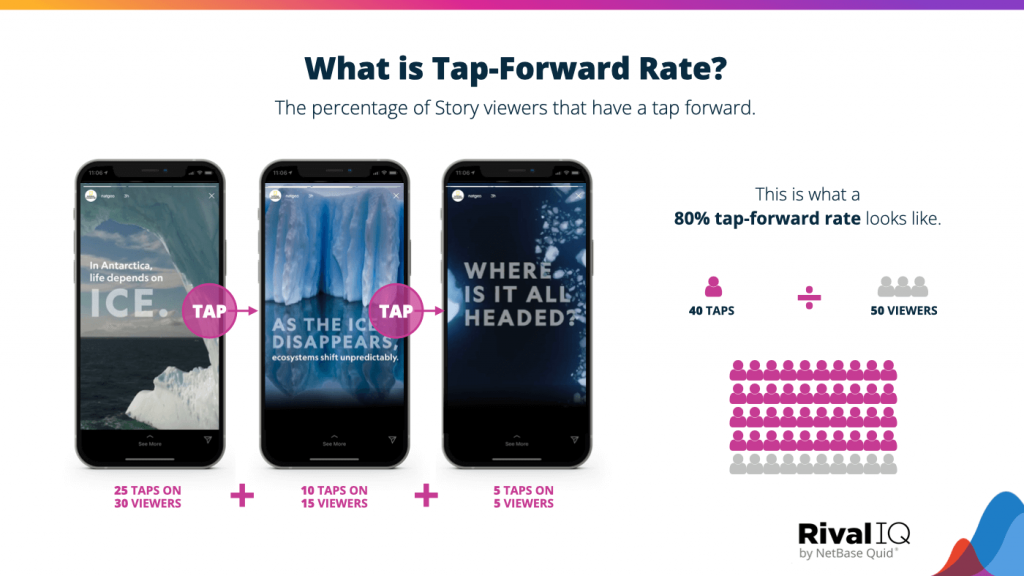
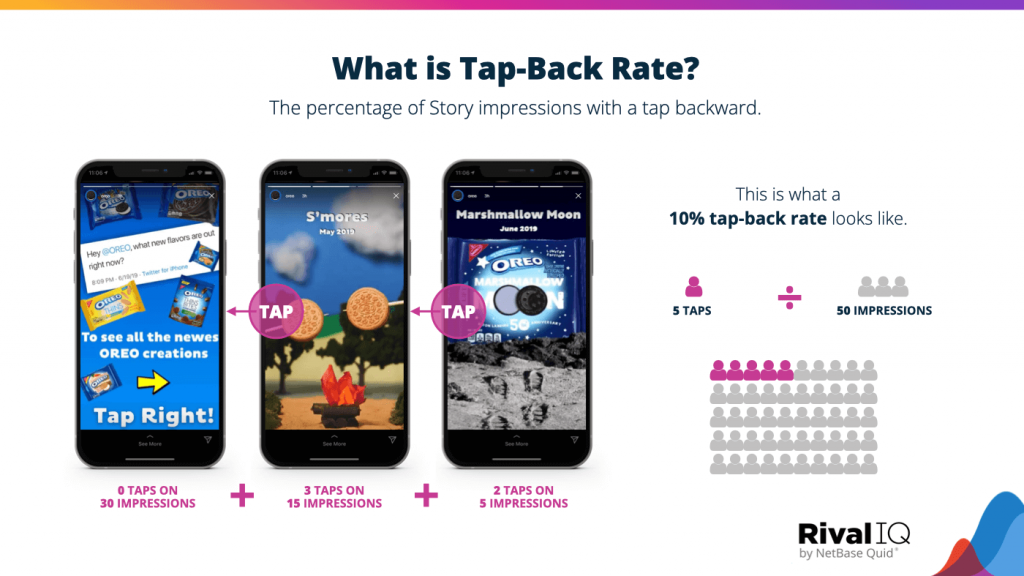
Tap forward and tap back rate
Tap-forward rate measures the percent of Story impressions that have a tap forward to the next frame. The number is high, at 90% of your Story contains more than four frames.
Tapping forward isn’t necessarily a bad thing, but it does indicate that the viewer has either seen enough of the content or wasn’t interested in the first place. Keep your frames engaging and experiment with video to maintain your viewers throughout the entire Story.
Tap back is when a viewer looks at a frame, moves forward, and then decides they want to go back and have a second look. The best brands (top 25%) see a tap-back rate of 7%, while the median tap-back rate is 4.8%. According to RivalIQ “taps back are a great indication of content that your followers want to consume more of.”
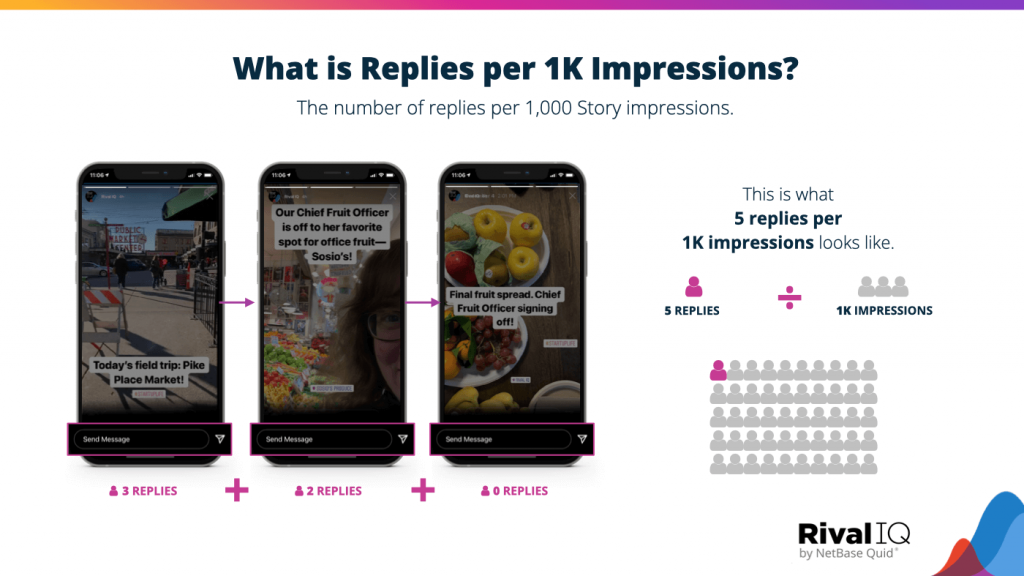
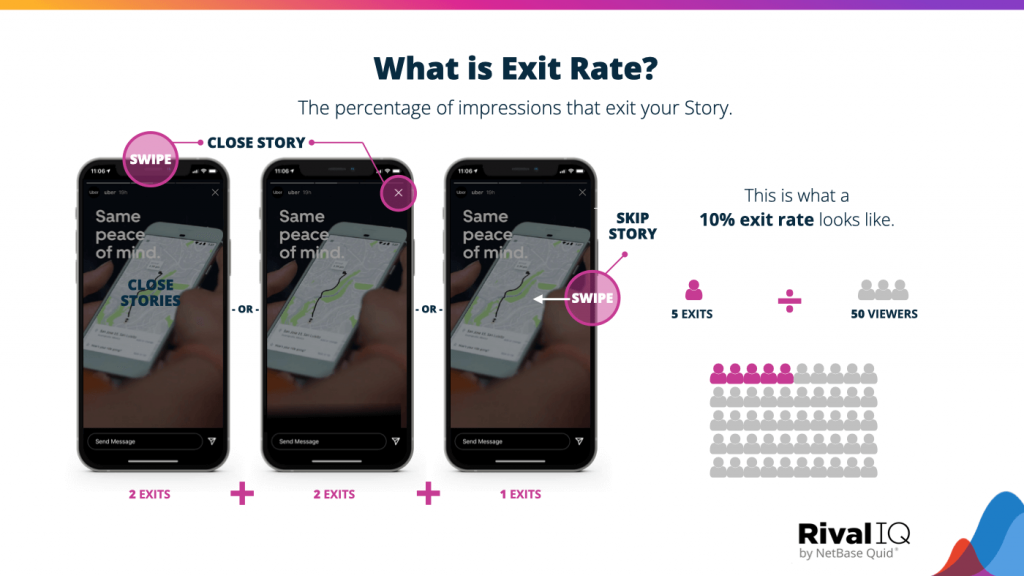
Reply and exit rates
Most users don’t reply to Stories, so don’t worry too much about a low reply rate. The top 25% of brands have a reply rate of just 1.35% per 1,000 impressions – a minuscule number! The median number is just 0.48 replies per 1,000 impressions for goodness sake!
And finally, exit rates are around 12% for a single frame story and declines for multi-frame stories until it lands at around 4% for four and more frame stories.
Recommended practices
Are you performing below these benchmarks? You need to make sure you do the following:
- Keep your first few frames as engaging as possible.
- Use interactive elements like stickers and quizzes.
- Drive traffic with links.
- Try and create a narrative to keep users tapping forward.
- Embrace longer text blocks and video (even if its a bit rustic).
- Use hashtags and locations.
- Keep it consistent and be accessible and inclusive.


RECOMMENDED FOR YOU
Meta Study: “Discovery Is Moving Beyond Google”
Meta believes the future of online discovery looks less…
Meta believes the future of online discovery looks less…
[STUDY] ChatGPT Powers Work And Life
OpenAI, in collaboration with Harvard economist David Deming, has…
OpenAI, in collaboration with Harvard economist David Deming, has…
LinkedIn Tests New Premium Tools for SMBs
LinkedIn is quietly piloting a new Premium offering designed…
LinkedIn is quietly piloting a new Premium offering designed…