RivalIQ has released its 2023 TikTok Benchmark Report that analyses metrics such as engagement rates, hashtags, mentions, posting frequencies and more to provide marketing managers with data to compare how their efforts are doing vs other brands.
TikTok Videos per Week
The average brand posted about eight times a month. However, the top 20% most active brands published five times a week on average – which is about half of Instagram’s average.
Accounts with more followers post more often. Those with over 1m averaged 4.3 a week, with those with zero to 5,000 averaging just 0.9 per week.
RivalIQ TikTok Benchmark Report
“Of course, having more followers doesn’t make you post more. Rather, accounts that consistently post a higher volume of quality videos are going to grow their accounts. As they grow, we see the investment in posting grow along with it.”
These findings show how important it is to post consistently and often. While that might seem like a big investment in creativity and hours spent dreaming up new content, or money spent chasing partnerships with influencers, there is clear evidence that the approach works.
Engagement Rate by View
Engagement rate by view measures how attention-grabbing your content is by dividing the number of engagements it earns and dividing it by the overall number of views.
The average number is 4.14% – only 16% of brands in the study earned double figures, so don’t freak out too much if you’re number is on the lower side.
Typically, the more followers an account has, the higher the engagement rate by view. Accounts with over one million followers reach an engagement per view of 7.5%, while those under 5,000 average 3.8%.
RivalIQ TikTok Benchmark Report
“Given the strong role that the FYP (for you page) algorithm plays in the world of TikTok, it isn’t surprising to see a positive correlation between account size and engagement rate by view. Brands with large followings didn’t get that way by creating mediocre content. Consistently producing high-engagement videos is a sure way to grow your following.”
Views per Follower
Views per follower is a nice way to see how your views stack up against your follower count.
The average post earns about 21.8 views per 100 followers per video – although the top 25% of brands earn 50 views per 100 followers.
At the other end of the spectrum, 30% of brands earn less than 10 views per 100 followers. So if that’s you, you can relax and know that you’re not the only one struggling to attract views. As we’ve seen with the two sections above, if you continue to post consistent, creative content, those views per follower can rise.
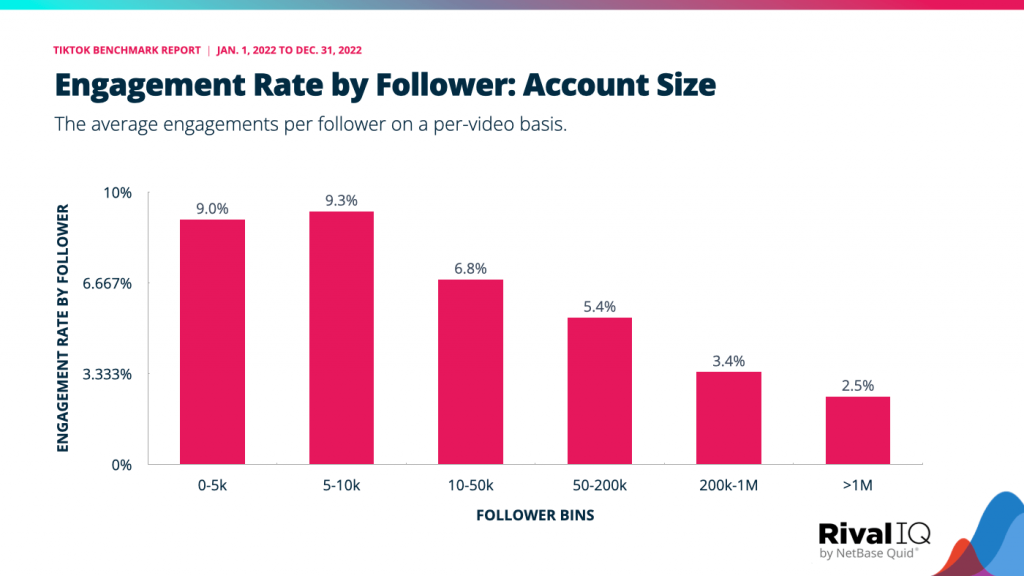
Engagement Rate by Follower
Engagement rate by follower is a handy tool that helps you measure your engagement vs your audience size. About 40% of brands have an engagement rate by follower of more than 8%, while 33% of brands have an engagement rate of less than 3%.
The average brand is earning around 5.7% engagement rate per follower. Accounts with over a million followers have an engagement per follower rate of around 2.5%, while accounts with under 5,000 followers have an engagement rate by follower of 9%.
Average Monthly Follower Growth
TikTok has grown rapidly over the last few years. Of course, that means there are more followers to try and attract – and on average, accounts with less than 50k followers grow at around 4% per month. Larger accounts grow at around 2.5% per month.
Accounts with 10-50,000 followers had the largest growth at around 5.5%.
Hashtags per Video
Across all social media platforms, marketers have to strike a balancing act. How many hashtags is too many? There definitely seems to be a science behind it – and on TikTok, less seems to be more.
The median number of hashtags is four per video (just 39% of brands include five or more).
Videos with Mentions
Including a mention in your video is a good way to improve reach – whether by replying to a comment left on an existing video or reaching out to a creator. Around 11% of brands live and die by this, including a mention in more than 50% of videos.
Meanwhile, nearly 9% of brands never include a mention at all.
Brands that use mentions in 10-20% of videos have the highest per-view engagement rate, while brands that never mention have a per-view engagement rate of just 4.5%
RivalIQ TikTok Benchmark Report
“Don’t be afraid to start conversations with mentions on TikTok. These numbers show that aiming to include a mention every fifth video (or more frequently) will boost engagement while helping grow follower counts as more fans discover your brand.”
RivalIQ’s latest report is available to view here.


RECOMMENDED FOR YOU
Instagram Looks Beyond Short Form Video
Instagram is preparing for a future where short-form video…
Instagram is preparing for a future where short-form video…
Instagram Algorithm Shake-up Pings Memes
Instagram is expanding its push towards original content, with…
Instagram is expanding its push towards original content, with…
TikTok Boosts Brand Discovery With Keywords
TikTok has introduced keyword controls that give brands more…
TikTok has introduced keyword controls that give brands more…